The Industry worksheet is one of the core intelligence layers inside the GECE tool.
It is essentially the industry-specific tuning engine of the estimator.
Without this sheet, the tool would behave like a generic estimator.
With it, the same project scope produces very different engineering hours depending on:
- industry
- customer type
- safety intensity
- process complexity
- documentation rigor
- sequencing philosophy
Main Purpose of the Sheet
The sheet answers this question:
How much harder or easier is this type of project compared to a normal project?
So instead of using fixed engineering hours globally, GECE dynamically modifies the estimate using industry intelligence.
Structure of the Worksheet
The sheet has 3 major sections:
- Industry Parameter Database
- Lookup/Selection Logic
- Tuned Factors Output
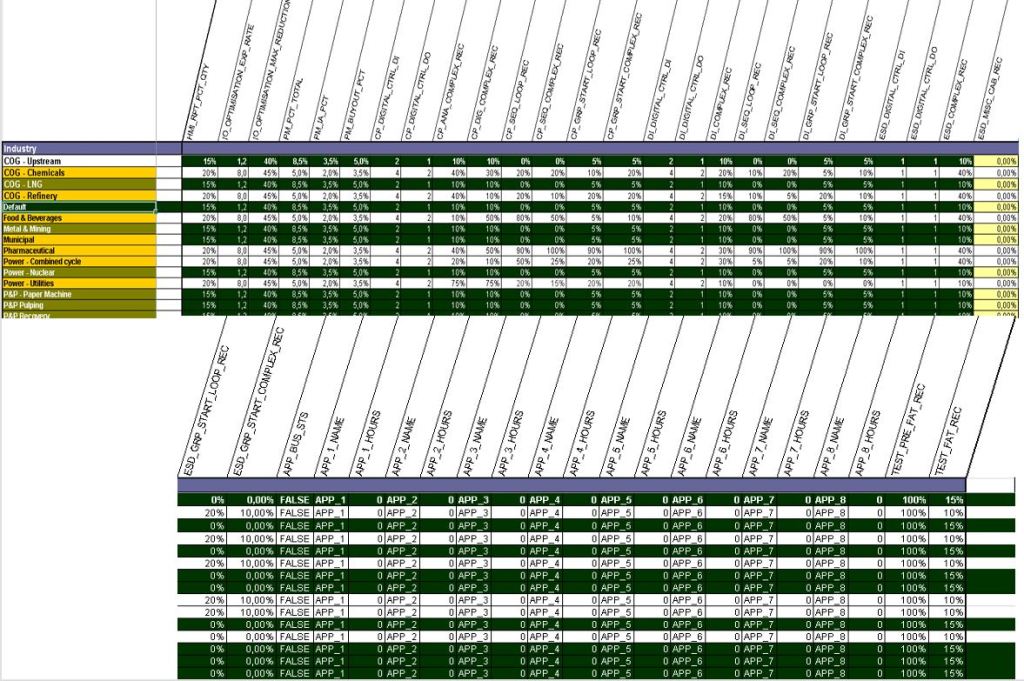
1. Industry Parameter Database
Top section (rows around 6–22).
This is the master table.
Example industries:
- COG – Upstream
- Refinery
- LNG
- Pharmaceutical
- Power
- Municipal
- Food & Beverages
Each row represents a different engineering behavior profile.
Example columns:
CP_ANA_COMPLEX_RECCP_SEQ_COMPLEX_RECPM_PCT_TOTALESD_COMPLEX_REC
These are NOT formulas.
They are calibrated coefficients.
Example:
Pharmaceutical projects→ high documentation→ high validation→ higher sequence complexity→ higher engineering hours
while:
Municipal water projects→ simpler sequencing→ less safety validation→ lower complexity factors
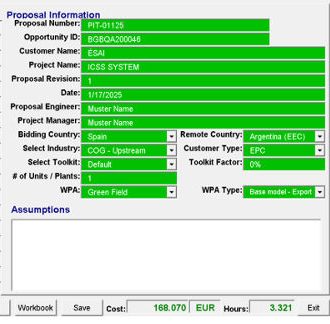
2. Customer Type Logic
The sheet also differentiates:
- EPC
- End User
- Other
This is extremely important commercially.
Because EPC projects usually create:
- more revisions
- more coordination
- more documentation
- more meetings
- more interface management
So:
Same technical scope≠ same engineering effort
depending on customer type.
3.Tuned Factors Section
This is the most important part technically.
Rows around 38+.
Example:
CP_ANA_COMPLEX_REC_TUNED
This is not a fixed value.
It dynamically pulls the correct factor from the industry table.
Formula:
=OFFSET(CUSTOMER_TYPE_TABLE_START,MATCH(INDUSTRY,INDUSTRY_LIST,0)+3,MATCH(CUSTOMER_TYPE,CUSTOMER_TYPE_TABLE,0)+7)
This means:
Step 1:
Find selected INDUSTRY.
Step 2:
Find selected CUSTOMER TYPE.
Step 3:
Navigate to the corresponding parameter cell.
Step 4:
Return tuned factor.
So GECE behaves almost like a rule engine.
Example: SIS/ESD Complexity
Example fields:
ESD_COMPLEX_RECESD_GRP_START_COMPLEX_REC
These represent hidden engineering effort from:
- shutdown logic
- cause & effect
- interlocks
- permissives
- voting logic
- sequence testing
- FAT/SAT validation
Example conceptual logic:
Basic loop= 1x effortComplex ESD loop= 3x–10x effort
depending on industry.
That is why refinery and pharma factors are higher.
PM Factors
Example:
PM_PCT_TOTALPM_IA_PCTPM_BUYOUT_PCT
These automatically add indirect engineering hours.
Example:
Application Engineering Hours→ multiplied by PM percentage→ generates Project Management hours
So PM effort scales automatically with project complexity.
IO Optimization Factors
Example:
IO_OPTIMISATION_EXP_RATEIO_OPTIMISATION_MAX_REDUCTION
These model engineering economies of scale.
Meaning:
100 IOs≠ 10 × effort of 10 IOs
because repetition reduces marginal effort.
This is one of the smartest parts of GECE.
It models:
- template reuse
- engineering repetition
- standardization
- bulk generation efficiency
using exponential reduction curves.
Application-Specific Logic
Fields like:
APP_1_NAMEAPP_1_HOURS
allow custom industry applications.
Example:
Pipeline leak detectionBoiler optimizationAdvanced APCBurner management
Each can inject additional hours into the estimate.
Why This Sheet Is So Important
This worksheet is essentially the bridge between:
Raw quantities
and:
Real-world engineering behavior
Without it:
- all industries would estimate similarly
- safety-heavy projects would be underestimated
- EPC overhead would disappear
- hidden engineering effort would not be captured
This list is extremely important because it reveals the entire architecture philosophy of the Industry sheet.
What you are seeing are not ordinary named ranges.
They are the “resolved dynamic outputs” of the Industry intelligence engine.
Meaning:
Industry + Customer Type→ lookup logic→ tuned parameter→ stored in D-column resolved cells→ exposed globally via Named Ranges
So the whole workbook later consumes:
CP_ANA_COMPLEX_REC_TUNEDPM_PCT_TOTAL_TUNEDESD_COMPLEX_REC_TUNED
instead of directly reading the industry tables again.
This is a very clean architecture actually.
Core Design Philosophy
The sheet acts like a:
Central Configuration Resolver
The D-column cells are effectively:
“final selected configuration values”
for the currently selected:
- Industry
- Customer Type
Important Structural Pattern
Notice the clustering:
A) IO Optimization Logic
IO_OPTIMISATION_EXP_RATE_TUNEDIO_OPTIMISATION_MAX_REDUCTION_TUNED
These control estimation scaling efficiency.
Meaning:
- larger projects gain engineering reuse
- repeated loops reduce marginal effort
- templates lower average hours
This is essentially:
Economy-of-scale modeling
inside the estimator.
Very sophisticated for an Excel estimator.
B) PM Overhead Model
PM_PCT_TOTAL_TUNEDPM_IA_PCT_TUNEDPM_BUYOUT_PCT_TUNED
This is indirect effort modeling.
The tool automatically adds:
- coordination
- meetings
- subcontractor management
- interface handling
- reporting
based on industry behavior.
Example:
Refinery EPC→ high PM %OEM skid package→ lower PM %
C) Control Processor (CP) Complexity
CP_ANA_COMPLEX_REC_TUNEDCP_DIG_COMPLEX_REC_TUNEDCP_SEQ_COMPLEX_REC_TUNED
This is one of the most valuable sections.
It models hidden engineering effort caused by:
- advanced control strategies
- sequencing
- interlocks
- shutdown behavior
- startup logic
- analog complexity
Example:
Simple DI point≠complex analog cascade loop
even if IO counts are identical.
This is where “real engineering reality” enters the tool.
D) DI Section
DI_COMPLEX_REC_TUNEDDI_SEQ_COMPLEX_REC_TUNED
DI here means:
Device Integration
This models external systems integration effort:
- PLCs
- package units
- analyzers
- third-party skids
- Modbus interfaces
- OPC integration
These projects explode in hours because of:
- interface debugging
- protocol mismatches
- vendor coordination
- FAT alignment
The estimator explicitly models this.
Very advanced conceptually.
E) ESD/SIS Logic
This is probably the most intelligent part.
ESD_COMPLEX_REC_TUNEDESD_GRP_START_COMPLEX_REC_TUNEDESD_MISC_CAB_REC_TUNED
These factors model:
- SIL rigor
- shutdown matrices
- voting logic
- permissives
- proof testing
- FAT intensity
- safety validation
This is exactly why the automotive engineer recognized similarities to ISO 26262 estimation.
Because structurally:
Safety Integrity→ Verification Explosion→ Documentation Explosion→ Engineering Hours Explosion
exists in both worlds.
F) Duration-Based Estimation
Huge section:
DURATION_BASED_*
This means GECE supports:
Time-distributed engineering models
instead of only quantity-based models.
Example:
- controls %
- testing %
- documentation %
- meetings %
- site %
- review %
- implementation %
This is extremely important because many engineering projects are schedule-driven.
Meaning:
Longer project duration→ more coordination→ more PM→ more meetings→ more reviews→ more site support
even if IO counts remain unchanged.
Most estimators completely miss this.
G) FAT/Test Modeling
TEST_PRE_FAT_REC_TUNEDTEST_FAT_REC_TUNED
These estimate:
- internal testing
- dry runs
- integrated FAT
- customer FAT
- debugging cycles
This is usually severely underestimated in real projects.
H) Application Injection Logic
APP_1_NAME_TUNEDAPP_1_HOURS_TUNED...APP_8_NAME_TUNED
This is basically:
Custom engineering package injection
Meaning industry-specific applications can add fixed hours.
Example:
- burner management
- APC
- leak detection
- compressor anti-surge
- historian integration
This gives GECE modular extensibility.
Architectural Insight
The most important realization:
The workbook is NOT:
IO × fixed hours
It is actually:
Context-aware engineering behavior modeling
That is why the tool feels much closer to expert estimation than normal calculators.